
The Ultimate Guide to Using Trendlines Effectively
Understanding and utilizing trendlines is a crucial skill for traders looking to identify long-term trends and make profitable trades. This detailed guide will walk you through the fundamentals of drawing trendlines, how to use them for trading decisions, common mistakes to avoid, and integrating other technical concepts to enhance your trading strategy.
Drawing Trendlines: The Basics
Getting Started: To begin with, it’s essential to wait for three confirmed points of contact before considering a trendline reliable. This confirmation is crucial because connecting any two points can create a trendline, but a third point validates its significance.
Candlestick Wicks vs. Bodies: A common question is whether to use the candlestick wicks or bodies when drawing trendlines. The key is to seek confluence—using whichever provides the most touchpoints without frequent violations. Consistency is also vital; decide on your approach and stick to it to minimize noise.
Example: Imagine two possible trendlines with multiple touches each. After the third touch, these trendlines are confirmed. Whether you use wicks or bodies, the critical factor is achieving consistent points of contact.
Upper and Lower Trendlines
Connecting Points:
- In a downtrend, connect the highs.
- In an uptrend, connect the lows.
This method helps identify trend-following trades and signals potential reversals when a trendline breaks.
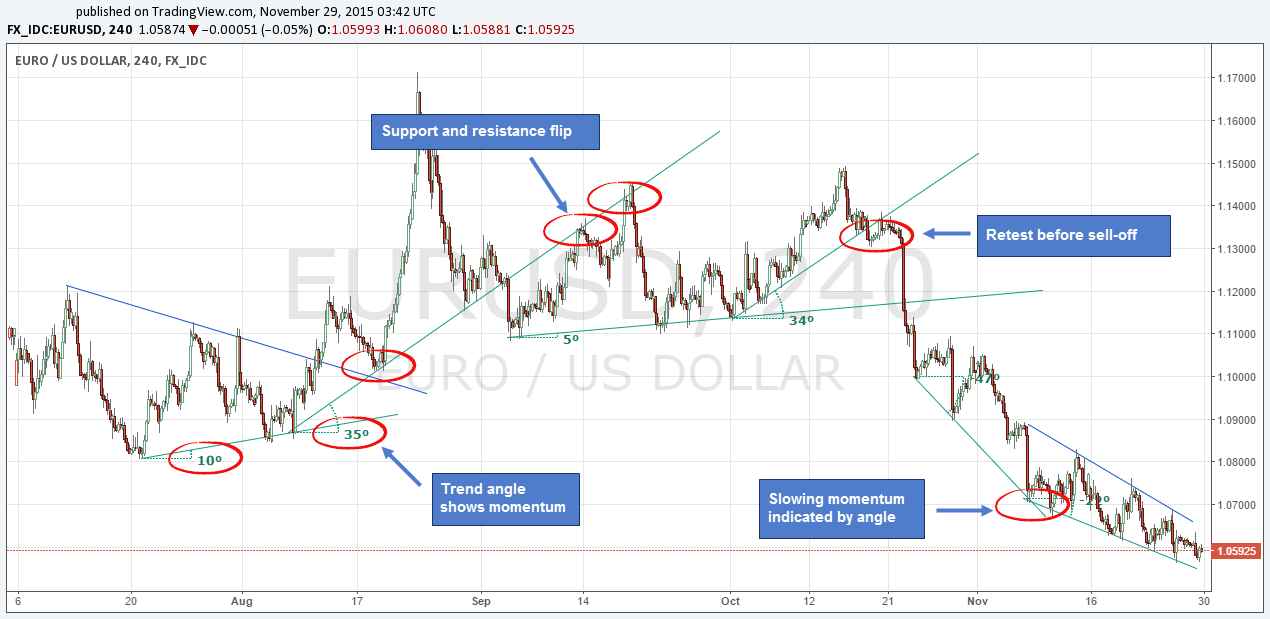
The Slope and Angles: Indicating Trend Strength
Steep Angles: A steep angle on an uptrend’s lower trendline indicates rapid rising lows and strong momentum. This pattern, known as the bump and thrust, shows an accelerating trend which may become unsustainable.
Decreasing Angles: In contrast, a downtrend with decreasing angle trendlines signals weakening momentum.
Analyzing Trend Structure
Primary Trend: Identify the primary trend, then look for consolidation phases within it. Trendlines with low angles during consolidation suggest limited bullish reversal potential. Consistently identifying these can lead to high-probability trade setups.
Trendline Patterns: The Wedge
Wedge Pattern: A wedge pattern, formed by converging trendlines, indicates market consolidation. A shallow lower trendline suggests weakening sellers. The final push often ends in a fake breakout, followed by a significant move in the opposite direction. Avoid new positions during consolidation and wait for the breakout to confirm a new trend.
Support and Resistance Flip
Trendline Flip: A trendline that previously acted as resistance can become support after a breakout. This flip is a potent indicator of trend continuation and provides a potential entry point. The strength of the flip depends on the overall trend direction and subsequent price action.
Trendline Takeoff
Recognizing Takeoff: A trendline takeoff occurs when the price surges away from the trendline with excessive momentum. This often indicates an overextended trend fueled by speculation. Such momentum usually leads to a market correction. Recognizing a trendline takeoff involves spotting a sharp deviation from the established trend, signaling potential overextension and cautioning against impulsive trades.
Conclusion
Trendlines are an invaluable tool for visualizing and trading market trends. Properly drawn trendlines can help identify trade entry and exit points, gauge trend strength, and recognize potential reversals. However, it’s crucial to maintain consistency in your approach and combine trendline analysis with other technical indicators to form a comprehensive trading strategy.
By understanding and applying these principles, you can navigate the complexities of the market more effectively, increasing your chances of making informed and profitable trades. Remember, while technical analysis is powerful, staying aware of market fundamentals and adapting to changing conditions is equally important for successful trading.

You may also like


Regulating Crypto-Assets: MiCA Regulation
